The Price of Sunshine: What Solar Panels Actually Cost in 2026
The Price of Sunshine: What Solar Panels Actually Cost in 2026
Published 2026-06-14 • Price-Quotes Research Lab Analysis
The Hardware Is Cheap. The Quote Is Not.
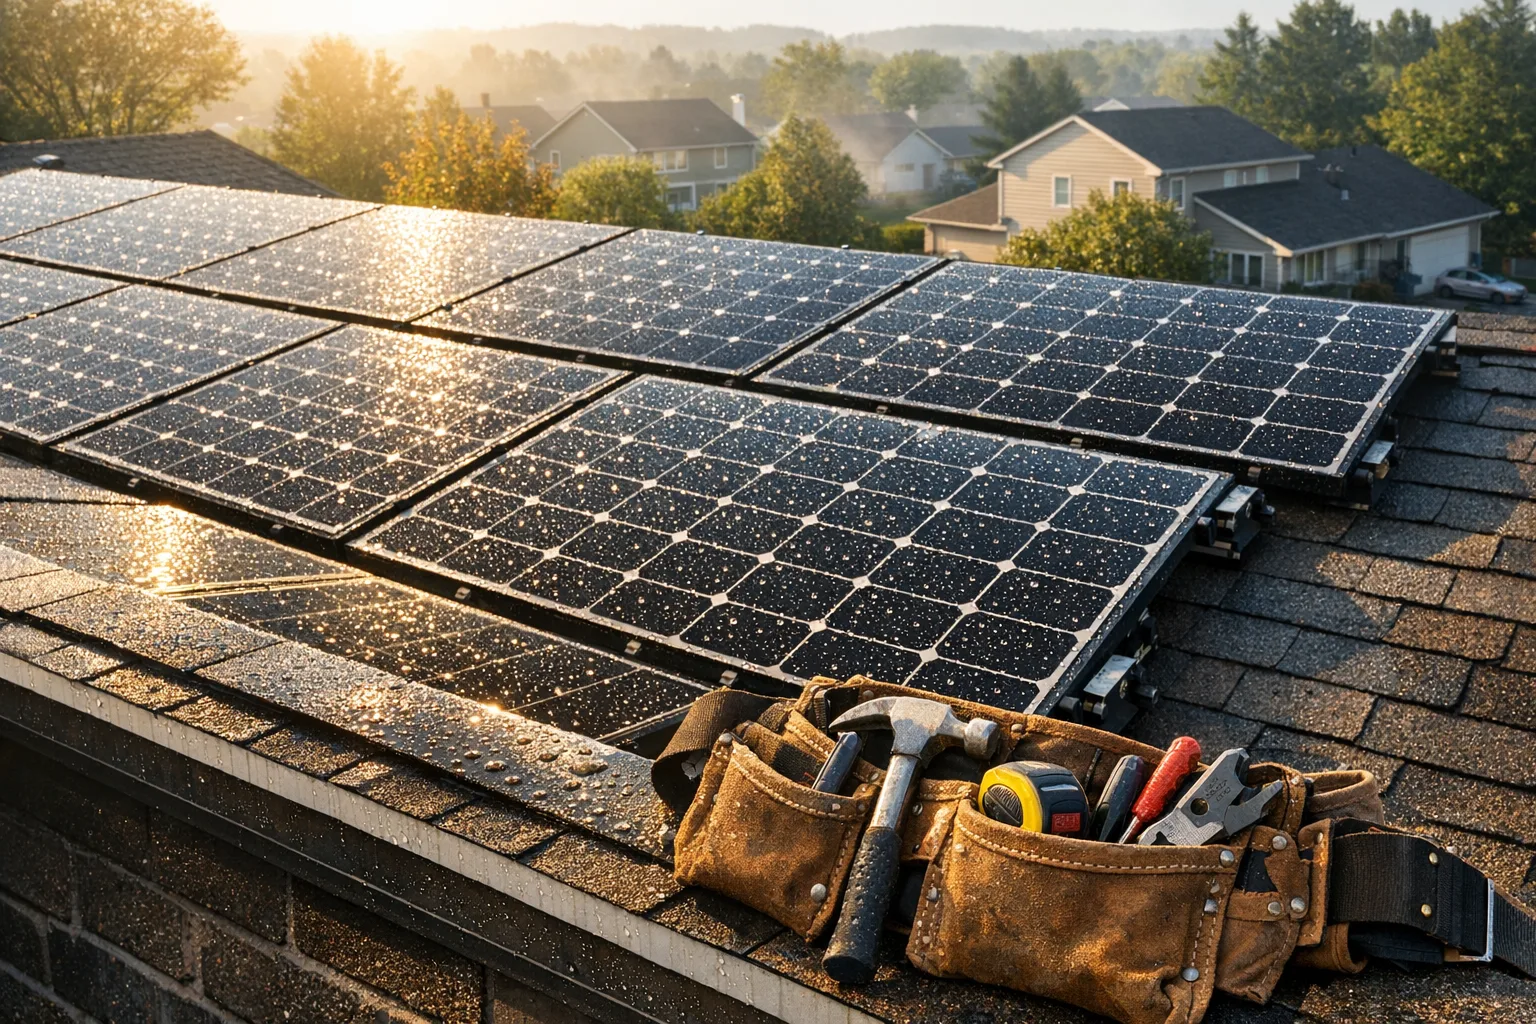
There is a moment that every solar shopper eventually encounters the gap between what they expected to pay and what appears on the estimate. Solar panels themselves have never been less expensive. A single 410-watt panel can run as little as $130 to $200, depending on the manufacturer and tier. Yet a full installation quote for a typical American home still lands somewhere between $18,000 and $32,000 before any incentives. Understanding why that gap exists and how it shapes the real cost of going solar in 2026 is the question at the heart of this guide.
The answer lies in a cost breakdown that most sales presentations gloss over. Of the $2.50 to $3.50 per watt that homeowners pay for a fully installed residential system, only $0.30 to $0.70 goes to the solar modules themselves. The rest flows to the inverter, the racking and balance-of-system hardware, the installation labor, the permitting and design fees, and the sales, overhead, and margin that keep installation companies operational. Labor and soft costs together make up more than half the total installed price, according to TheGreenWatt's 2026 cost breakdown.
This matters because it reframes the conversation. The question is not simply "are solar panels cheaper?" but rather "what is actually driving the price of a complete solar installation, and where can a homeowner find real savings?"
The Federal Credit Is Gone. What Replaces It?
One of the most consequential changes for homeowners in 2026 is the elimination of the federal residential solar tax credit. The 25D Residential Clean Energy Credit which allowed homeowners to deduct 30% of a solar installation's cost from their federal taxes expired on December 31, 2025, as part of the One Big Beautiful Bill. On a $22,000 system, that credit was previously worth $6,600 in direct tax reduction. In 2026, it is worth zero for homeowners who purchase their system with cash or a loan.
"If you purchase a solar system with cash or a loan in 2026, there is no federal tax credit applied to that purchase." EnergyScout's 2026 solar cost guide
This is a fundamental shift in the economics of residential solar. For years, the federal tax credit was the single largest financial incentive available to homeowners, often making the difference between a 10-year payback and a 7-year one. Its absence does not make solar a bad investment but it does change the math, and homeowners need to understand the new landscape before signing a contract.
Leases and Power Purchase Agreements (PPAs) occupy a different position in 2026. Because the commercial Investment Tax Credit (ITC) remains available for corporate-owned systems, the company that owns a leased or PPA system can still capture that credit and pass the savings through to the homeowner via lower monthly payments. For homeowners who prefer low upfront costs, leases and PPAs have become a more prominent option than they were in prior years, as Solar.com's 2026 pricing analysis notes.
Where the Money Goes: A Cost Breakdown
To understand what drives a solar quote, it helps to see where each dollar actually goes. The following breakdown reflects the cost per watt for a typical installed residential system in 2026:
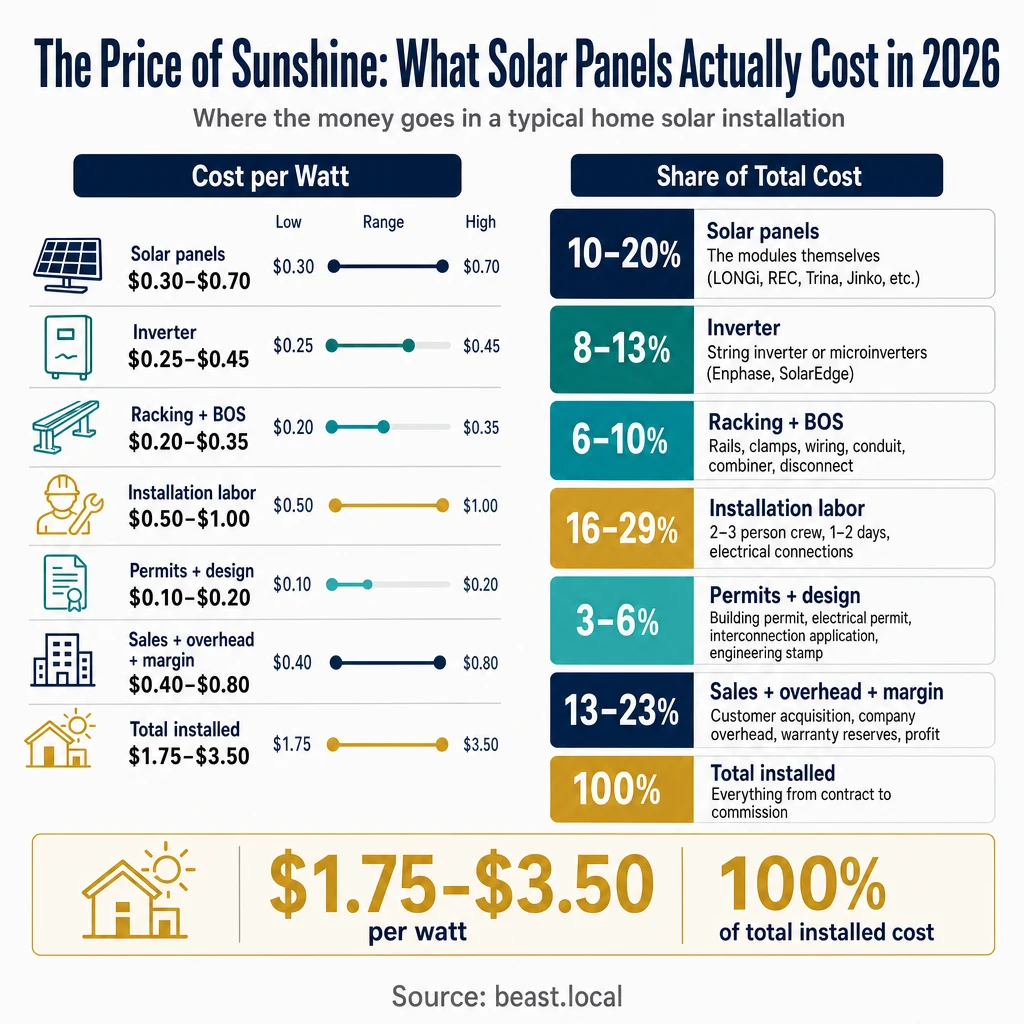
| Component | Cost per Watt | % of Total | What It Covers |
|---|---|---|---|
| Solar panels | $0.30-$0.70 | 10-20% | The modules themselves (LONGi, REC, Trina, Jinko, etc.) |
| Inverter | $0.25-$0.45 | 8-13% | String inverter or microinverters (Enphase, SolarEdge) |
| Racking + BOS | $0.20-$0.35 | 6-10% | Rails, clamps, wiring, conduit, combiner, disconnect |
| Installation labor | $0.50-$1.00 | 16-29% | 2-3 person crew, 1-2 days, electrical connections |
| Permits + design | $0.10-$0.20 | 3-6% | Building permit, electrical permit, interconnection application, engineering stamp |
| Sales + overhead + margin | $0.40-$0.80 | 13-23% | Customer acquisition, company overhead, warranty reserves, profit |
| Total installed | $1.75-$3.50 | 100% | Everything from contract to commission |
What this table reveals is that the solar panel is almost incidental to the total cost. The inverter, the racking, the labor, the permits, and the overhead these are the components that make solar expensive, and they are also the areas where cost reductions are hardest to achieve. This is why hardware price drops do not automatically translate into lower installation quotes, and why comparing quotes on a per-watt basis matters more than chasing the lowest panel price.
System Size and What It Means for Your Budget
Solar costs are quoted by system size, measured in kilowatts (kW). The size you need depends on your household's electricity consumption, your roof's usable area, and your goals whether that is offsetting a portion of your bill or achieving full energy independence.
Here is how typical system sizes translate into installed costs in 2026:
| System Size | Panel Count (approx.) | Before Incentives | After 30% ITC (historical) | Best For |
|---|---|---|---|---|
| 4 kW | 10 panels | $10,000-$14,000 | $7,000-$9,800 | Small home, $80-100/mo bill |
| 6 kW | 15 panels | $15,000-$21,000 | $10,500-$14,700 | Average home, $120-150/mo bill |
| 8 kW | 20 panels | $20,000-$28,000 | $14,000-$19,600 | Larger home, $180-220/mo bill |
| 10 kW | 25 panels | $25,000-$35,000 | $17,500-$24,500 | Large home, $250+/mo bill |
| 12+ kW | 30+ panels | $30,000+ | $21,000+ | High usage or EV charging |
Note that the "After 30% ITC" column reflects the historical credit available through 2025. Homeowners in 2026 who purchase with cash or a loan do not receive this credit. State incentives, which vary widely, remain the primary financial lever available in 2026.
Regional Variation: Why Your Zip Code Changes the Price
One of the most underappreciated factors in solar pricing is geography. A 6 kW system in Arizona might cost $15,000. The same system in New York or California could run $19,000 or more. Regional differences drive large price swings states with high labor costs, complex permitting processes, and lengthy grid interconnection requirements can be 20 to 40 percent above the national average, according to Solar Power CEE's 2026 cost analysis.
This variation stems from several factors. Labor rates differ substantially between regions a licensed electrician in Manhattan commands a different wage than one in rural Tennessee. Permitting timelines and fees vary from city to city and county to county. Some utilities have straightforward interconnection processes; others have backlogs that add months to a project timeline and require additional engineering reviews.
For homeowners, this means that national average pricing is a starting point, not a quote. The only way to get an accurate number for a specific home is a site-specific assessment that accounts for roof design, shading, electrical panel capacity, local permitting requirements, and installer competition in the region.
Why This Matters for Solar Panel Costs in 2026 Readers
If you are researching solar panel costs in 2026, the practical takeaway is this: the headline number you see whether it is $2.50 per watt or $3.50 per watt is only the beginning of the conversation. The real cost of a complete solar installation is shaped by soft costs, regional labor rates, permitting complexity, and the availability of state-level incentives. The federal tax credit that once made solar dramatically more affordable for homeowners is no longer available for cash and loan purchases as of January 1, 2026.
This does not mean solar is a bad investment. For many homeowners, the long-term savings on electricity bills still justify the upfront cost, especially in states with strong net metering policies or utility incentives. But the economics have shifted, and the decision framework is different than it was even two years ago. Understanding the cost breakdown not just the per-watt price is the key to evaluating a quote intelligently and avoiding surprises.
State Incentives: The New Primary Lever
With the federal credit no longer available for most homeowners, state and local incentives have become the most important financial consideration for anyone going solar in 2026. These incentives vary widely. Some states offer upfront rebates, others provide tax credits, and many operate net metering programs that allow homeowners to sell excess electricity back to the grid at favorable rates.
California, New York, Massachusetts, and several other states have historically offered some of the most robust state-level solar incentives. Programs like the California Solar Initiative, New York's NY-Sun program, and state-specific rebate structures have helped offset costs for homeowners in those markets. However, program availability and structure change frequently, and homeowners are advised to check with their state energy office and local utility for current offerings before making a purchase decision.
The SolarCalc guide notes that state incentives can stack with utility rebates and local programs to reduce out-of-pocket costs by an additional 10 to 25 percent in some markets, though the exact amount depends heavily on location and program eligibility.
The Role of Battery Storage
Adding home battery storage to a solar installation is increasingly common, particularly in regions with grid reliability concerns or time-of-use electricity pricing. Battery storage allows homeowners to store excess solar generation for use during evening hours, when electricity rates are often highest, or during grid outages.
In 2026, a battery-only installation typically costs $9,000 to $20,000 depending on battery size and any required electrical upgrades. Adding battery storage to a solar system increases the total project cost by $6,000 to $12,000 for common 4 to 10 kWh usable systems, with variation by chemistry, capacity, and installation complexity. The national average for a complete solar plus battery installation falls around $28,000 to $50,000 or more, depending on system design.
Battery costs have declined substantially over the past decade, but they remain a significant line item. For homeowners in areas with favorable net metering policies, the economic case for battery storage is weaker the ability to export excess solar to the grid at retail rates reduces the urgency of self-consumption. For those in areas with time-of-use pricing or limited net metering, battery storage can improve the overall return on investment substantially.
Payback Periods and Long-Term Savings
Despite the absence of the federal tax credit in 2026, solar installations still offer meaningful long-term savings for most homeowners. Typical payback windows range from about 6 to 12 years depending on local electricity rates, available incentives, financing costs, and system performance. Lifetime savings often equal multiple times the net installed cost over a 25-year panel warranty period.
The key variables are straightforward: the higher your local electricity rate, the faster solar pays for itself. A homeowner in Hawaii, where electricity costs exceed $0.40 per kilowatt-hour, will see a faster payback than one in Louisiana, where rates are among the lowest in the country. System performance influenced by roof orientation, shading, and local climate also plays a role in determining actual savings over time.
Solar also adds measurable value to a home. Industry estimates suggest that each kilowatt of installed solar capacity adds approximately $4,000 to a home's value, according to TheGreenWatt's cost and value analysis. This means that even if the payback period extends beyond the industry average, homeowners are building equity in their property that will be realized upon sale.
Getting Accurate Quotes: What to Ask For
Given the complexity of solar pricing, the most important step a homeowner can take is to obtain multiple detailed quotes before committing to an installation. The solar industry recommends getting at least three quotes from different installers, comparing not just the total price but the equipment specified, the warranty terms, and the estimated production figures.
Here are the key questions to ask every installer:
- What panels and inverter are specified, and why?
- What is the estimated annual production in kilowatt-hours?
- What is the total installed cost per watt?
- What permitting and interconnection support is included?
- What warranty coverage is provided for equipment, labor, and installation?
- Are there any state or utility incentives the installer will help apply for?
Installer pricing can vary 20 to 30 percent between companies for the same system, according to SolarCalc's 2026 cost guide. This variance makes comparison shopping essential, but it also means that the cheapest quote is not always the best one. The quality of the installation, the reliability of the equipment, and the responsiveness of the installer over the 25-year life of the system are worth paying a premium for.
What to Watch Next
The solar industry in 2026 is navigating a period of significant policy transition. The elimination of the federal residential tax credit has reshaped the economics of ownership, while commercial and community solar programs continue to benefit from remaining incentive structures. For homeowners, the practical path forward involves understanding the true cost breakdown of a solar installation, evaluating state and local incentives, and approaching the decision with clear eyes about both the savings potential and the trade-offs involved.
Several trends bear watching in the months and years ahead. Supply chain dynamics, including the price of raw materials like silicon, silver, and glass, continue to influence module pricing. Manufacturing efficiency gains have driven down per-watt costs substantially over the past decade, and that trajectory is expected to continue, though at a slower pace. Regional variation in pricing is likely to persist as long as labor markets and permitting processes remain locally controlled.
For homeowners who have been waiting for the right moment to go solar, 2026 offers a mixed landscape: hardware is cheaper than ever, but the financial incentives that once made the decision easier are substantially reduced. The question is no longer whether solar makes sense in the abstract for many homeowners, it still does but whether the numbers work for a specific home, in a specific location, with a specific set of incentives available.
Where to Read Further
For homeowners ready to explore solar costs in more detail, the following resources offer current pricing data, state incentive listings, and comparison tools:
- Solar.com's 2026 solar pricing analysis covers policy changes, federal credit elimination, and the outlook for residential installation pricing
- EnergyScout's 2026 solar cost guide provides system-size pricing breakdowns and explains the federal credit change
- TheGreenWatt's 2026 cost per watt breakdown details component-level costs and the federal credit timeline
- Solar Power CEE's 2026 cost analysis covers regional variation, payback periods, and technology trends
- SolarCalc's 2026 cost guide offers system-size pricing tables and state incentive stacking guidance