The New Math of Solar: What Homeowners Need to Know About Panel Costs in 2026
The New Math of Solar: What Homeowners Need to Know About Panel Costs in 2026
Published 2026-06-14 • Price-Quotes Research Lab Analysis

The End of the Federal Credit: A New Era for Solar Economics
For five years, the federal Investment Tax Credit (ITC) functioned as a financial cushion that made residential solar accessible to millions of American homeowners. The 30% credit, established under the Inflation Reduction Act, allowed buyers to subtract nearly a third of their system cost from their federal tax liability. That window closed on December 31, 2025.
The implications are concrete. According to TheGreenWatt's 2026 pricing analysis, a homeowner purchasing a typical 8 kW system in 2026 pays approximately $7,000 more in net costs than they would have in 2024. The credit did not simply reduce the sticker price it multiplied savings over time by lowering the principal amount on which all future calculations rested.
Yet the solar industry is not collapsing. Data from SolarReviews' June 2026 analysis shows that the average home solar installation still costs between $21,816 and $26,004, depending on whether the homeowner pays cash or finances. The question is no longer whether solar makes financial sense it is whether it makes sense for your specific house, your specific utility rates, and your specific state incentive landscape.
What a Solar System Actually Costs in 2026
The solar industry prices everything in dollars per watt because it normalizes across system sizes, panel wattages, and geographies. When an installer quotes $3.10 per watt, they mean the total installed cost panels, inverter, racking, wiring, labor, permits, and profit divided by the system's DC wattage.
In 2026, that figure lands between $2.50 and $3.50 per watt for most residential installations. The median, according to industry data, sits at approximately $3.03 per watt. But that number obscures a more granular reality: where your money actually goes.
Of every dollar you spend on an installed residential solar system, only $0.30 to $0.70 goes toward the panels themselves. The inverter takes $0.25 to $0.45. Racking and balance of system components rails, clamps, wiring, conduit add another $0.20 to $0.35. Installation labor, typically a two-to-three-person crew working one to two days, accounts for $0.50 to $1.00. Permits and design work building permits, electrical permits, interconnection applications, engineering stamps run $0.10 to $0.20. The remainder, $0.40 to $0.80, covers customer acquisition, company overhead, warranty reserves, and profit.
This breakdown matters because it explains why solar costs vary by geography. Labor rates differ dramatically between metropolitan Columbus, Ohio and rural Montana. Permitting complexity and timelines differ between municipalities. These soft costs not the panels themselves are the primary drivers of regional price differences.
System Size and Cost Examples
For a typical homeowner, system size correlates directly with household electricity consumption. The data from SmartEnergyUSA's Columbus, Ohio analysis illustrates the pricing structure clearly:
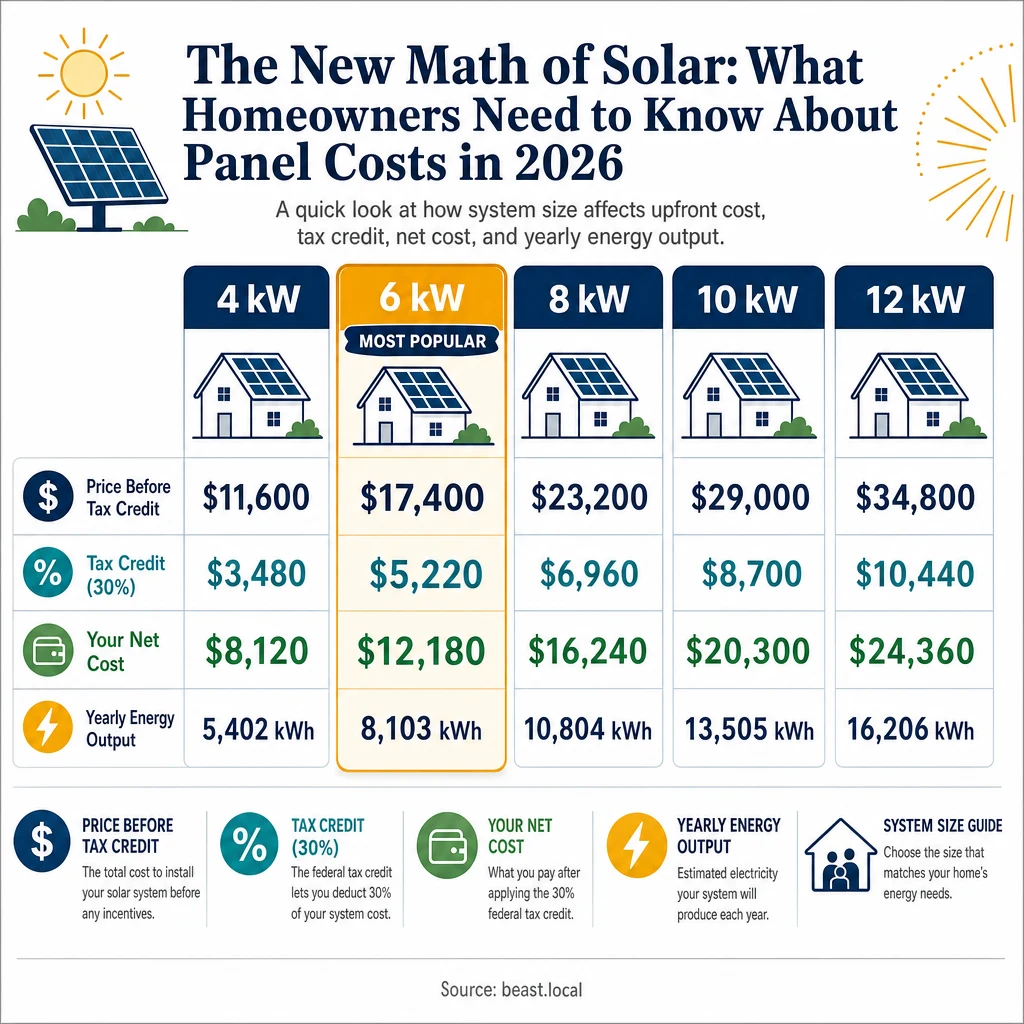
| System Size | Cost Before Incentives | Federal Tax Credit (30%) | Net Cost | Est. Annual Production |
|---|---|---|---|---|
| 4 kW | $11,600 | $3,480 | $8,120 | 5,402 kWh |
| 6 kW (Most Popular) | $17,400 | $5,220 | $12,180 | 8,103 kWh |
| 8 kW | $23,200 | $6,960 | $16,240 | 10,804 kWh |
| 10 kW | $29,000 | $8,700 | $20,300 | 13,505 kWh |
| 12 kW | $34,800 | $10,440 | $24,360 | 16,206 kWh |
Note: The federal tax credit figures above reflect 2025-era pricing. In 2026, without the credit, the net cost column becomes the full cost before incentives.
The 6 kW system remains the most popular residential size, which aligns with the average American home's electricity consumption of approximately 900 to 1,000 kWh per month. A 6 kW system producing roughly 8,100 kWh annually covers a significant portion of that usage, though not necessarily 100% without battery storage or careful load management.
Payback Periods: How Long Until Solar Pays for Itself
The solar payback period the time required for electricity bill savings to equal the upfront cost of installation is the metric that determines whether solar is a sound investment for a given homeowner. In 2026, payback periods vary meaningfully by location, utility rates, and system performance.
Columbus, Ohio homeowners typically see payback periods of approximately 9 years, according to SmartEnergyUSA's regional analysis. Across Ohio more broadly, the figure stretches to 12.89 years, according to EnergySage's Ohio data. The difference reflects varying utility rates, sun exposure, and local installation costs across the state's diverse geography.
These numbers assume the homeowner purchases the system with cash. When financing enters the picture, the math changes. Solar-specific loans typically include dealer fees that add an average of 19.99% to the principal of the loan. By the end of a typical 20-year loan with 5.99% interest, a homeowner pays approximately $31,273 in total loan payments for a 7.2 kW system that cost $21,816 upfront. The interest and fees effectively extend the payback period by several years.
What this means for solar panel costs readers: the financing choice matters as much as the system choice. A cash purchase delivers the best long-term savings. A solar loan preserves ownership while spreading costs, but buyers should seek subsidized clean energy loans through local incentive programs when available, as these typically carry lower interest rates than private solar loans.
State and Local Incentives: The Programs Still Available in 2026
Even without the federal ITC, a patchwork of state and local programs remains available to reduce the net cost of solar installation. These programs vary significantly by location, making regional research essential before signing any contract.
Ohio offers several notable incentives. The Solar Renewable Energy Credit (SREC) market allows homeowners to earn credits by generating solar electricity, with current market values ranging from $10 to $25 per SREC. Ohio's Renewable Portfolio Standard requires utilities to source a percentage of energy from solar, creating ongoing demand for these credits. The state's property tax exemption eliminates taxes on the added value that solar equipment brings to a property a meaningful benefit in areas with high property tax rates.
Net metering remains available in Ohio for residential solar customers of investor-owned utilities. Under net metering, homeowners receive credits at the full retail electricity generation rate for excess power sent back to the grid. This mechanism allows solar owners to build up credits during high-production summer months and draw them down during lower-production winter periods.
Across the country, state incentives range from $0 to $8,000 depending on location, according to TheGreenWatt's incentive survey. States like California, Massachusetts, and New York have historically offered more robust incentive programs, while other states rely primarily on net metering and SREC markets. Homeowners should verify current program availability with their state energy office, as incentive structures shift with legislative and regulatory changes.
Electricity Bill Savings: What Homeowners Actually Keep
The savings story is where solar makes its strongest case. Over a 25-year system lifespan, Columbus homeowners can expect to save approximately $28,000, according to SmartEnergyUSA's analysis. Ohio homeowners broadly see 25-year savings of approximately $45,442, with an electricity offset of 87%, according to EnergySage's data.
These figures represent the difference between what homeowners would have paid their utility over 25 years alongside what they paid their solar system over the same period. They account for electricity rate inflation a factor that makes solar increasingly valuable as utility rates rise. The U.S. Energy Information Administration has documented steady electricity rate increases over the past decade, and most analysts project that trend continuing.
The electricity offset percentage matters as much as the dollar savings. A system that covers 87% of a homeowner's electricity needs means they still purchase some power from the grid, typically during evening hours when solar production is zero. Homes with battery storage can increase their offset percentage by storing midday production for evening use, though battery systems add $10,000 to $15,000 to the upfront cost.
Home Value Impact: What Solar Adds to Your Property
Multiple studies have examined the relationship between solar installations and home resale values. The consensus finding: solar panels add approximately $4,000 per kilowatt installed to home value. A 6 kW system, therefore, might add roughly $24,000 to a home's appraised value.
This premium reflects several factors. Homes with solar panels have lower operating costs, making them more attractive to buyers who anticipate staying for multiple years. In states with strong net metering programs, solar-equipped homes offer the additional benefit of potential income from SREC sales. The property tax exemption for solar value in states like Ohio means that the appraised value increase does not trigger higher property taxes.
The home value benefit partially offsets the upfront cost of solar installation. When a homeowner sells a property with a paid-off solar system, they recover a portion of their initial investment through the sale price. This dynamic makes solar a hybrid investment part energy savings, part home improvement, part hedge against future electricity rate increases.
Regional Variation: Why Your Zip Code Changes the Numbers
Solar costs vary meaningfully by location, driven primarily by differences in labor rates, permitting complexity, and local market competition. The data from SolarReviews' state-by-state analysis reveals significant variation across the country.
States with higher labor costs California, New York, Massachusetts typically see higher installed costs per watt. States with active solar markets and multiple competing installers often see lower prices due to competition. States with streamlined permitting processes reduce soft costs, while states with complex or slow permitting add to the total.
Sun exposure matters, but less than many homeowners assume. A system in cloudy Seattle still produces meaningful electricity and still pays back the payback period simply extends because annual production per watt is lower. The critical factors are electricity rates (higher rates make solar more valuable), net metering terms (better credits accelerate payback), and upfront costs (lower costs shorten the payback period).
For homeowners in Ohio, the combination of solid net metering, an active SREC market, and a property tax exemption makes solar a favorable investment despite the state's moderate sun exposure. The state's Renewable Portfolio Standard creates ongoing demand for solar credits, supporting the SREC market that provides additional income for solar owners.
Making the Decision: Cash, Loan, Lease, or PPA
The financing structure matters as much as the system itself. Each option carries distinct advantages and trade-offs that homeowners should evaluate carefully.
A cash purchase delivers the best long-term savings. The homeowner owns the system outright, receives all electricity bill savings, and captures 100% of any SREC income. There is no interest, no dealer fee, and no monthly payment. The tradeoff is the upfront capital requirement.
A solar loan allows homeowners to retain ownership while spreading costs over time. The best loans come through subsidized clean energy programs offered by state energy offices, credit unions, or community development financial institutions. Private solar loans from installers typically carry higher interest rates or upfront fees that reduce net savings.
Solar leases and Power Purchase Agreements (PPAs) involve a third-party company owning the system. Under a lease, the homeowner pays a fixed monthly fee. Under a PPA, the homeowner pays for the electricity the system produces at a predetermined rate. Both options require little to no upfront capital and often include maintenance coverage. The tradeoff is that the homeowner does not own the system, cannot capture SREC income directly, and may face complications when selling the home.
For homeowners who choose leasing or PPA arrangements, the recommendation from EnergySage's analysis is to select offerings with low annual escalators typically 0% to 2% to ensure the arrangement continues providing savings over the system's 25-year lifespan.
What This Means for Homeowners Considering Solar in 2026
The expiration of the federal ITC changes the calculus but does not eliminate the case for solar. For most American homeowners, electricity rate inflation alone makes solar an attractive long-term investment. A system that costs $21,816 in 2026 and saves $1,200 annually in electricity costs pays for itself in approximately 18 years through bill savings alone leaving seven years of essentially free electricity before the system reaches its typical 25-year lifespan.
State and local incentives remain meaningful. SREC markets, property tax exemptions, and net metering programs continue to provide value. Homeowners should research their specific state's offerings before making a decision.
The home value benefit partially de-risks the investment. Even if a homeowner sells before the payback period completes, they recover a portion of their investment through the sale price.
The critical variables are location, electricity rates, system cost, and financing terms. A homeowner in a high-electricity-rate state with access to state incentives and a subsidized loan may find solar an unambiguous win. A homeowner in a low-rate state with no additional incentives and a high-fee solar loan may find the economics marginal.
The path forward is comparison shopping. Platforms like EnergySage and SolarReviews allow homeowners to receive and compare multiple quotes from vetted installers. The solar market remains competitive, and prices vary meaningfully between installers. Taking the time to gather three to five quotes typically reveals a range of $5,000 to $10,000 for the same system specifications.
Where to Read Further
For homeowners ready to explore specific regional pricing, EnergySage's Ohio solar data provides detailed local market analysis updated through June 2026. SmartEnergyUSA's Columbus-specific guide offers system-size pricing tables and current incentive information. TheGreenWatt's cost breakdown explains the per-watt pricing structure and component costs in detail. SolarReviews' national overview provides state-by-state cost comparisons and expert analysis of financing options.