The New Math of Going Solar in 2026
The New Math of Going Solar in 2026
Published 2026-06-14 • Price-Quotes Research Lab Analysis
The Starting Point: A Changed Landscape
For years, the math of going solar came with a familiar cushion. The federal Residential Clean Energy Credit the 30% tax credit under Section 25D of the Internal Revenue Code offset a meaningful portion of the upfront cost for homeowners who purchased their systems outright or through a loan. On a $22,000 system, that credit was previously worth $6,600 in direct tax reduction. For many households, it was the difference between a decade-long payback and a five-year one.
That credit expired on December 31, 2025, as part of the One Big Beautiful Bill. For homeowners entering 2026, the financial calculus has shifted. This is not a reason to dismiss solar but it is a reason to recalibrate expectations and understand exactly what the current market looks like, where the costs actually live, and which levers still work in a homeowner's favor.
The solar industry prices everything in dollars per watt ($/W) because it normalizes across system sizes, panel wattages, and geographies. When an installer quotes $3.10 per watt, they mean the total installed cost panels, inverter, racking, wiring, labor, permits, and profit divided by the system's DC wattage. Understanding this metric is the first step to making sense of any solar proposal.
What Solar Actually Costs in 2026
Based on current market data tracked by the Solar Energy Industries Association (SEIA), the average cost of a residential solar panel system in the United States sits at roughly $3.00 per watt before incentives in early 2026. For a typical 8-kilowatt home system, that works out to around $24,000 upfront a number that drops significantly once federal and state incentives are applied.
More specifically, according to current pricing data, solar panels cost $2.50-$3.50 per watt fully installed in 2026. For a typical 8 kW residential system, that is $20,000-$28,000 before incentives. Individual 410 W panels cost $130-$200 each (panel only).
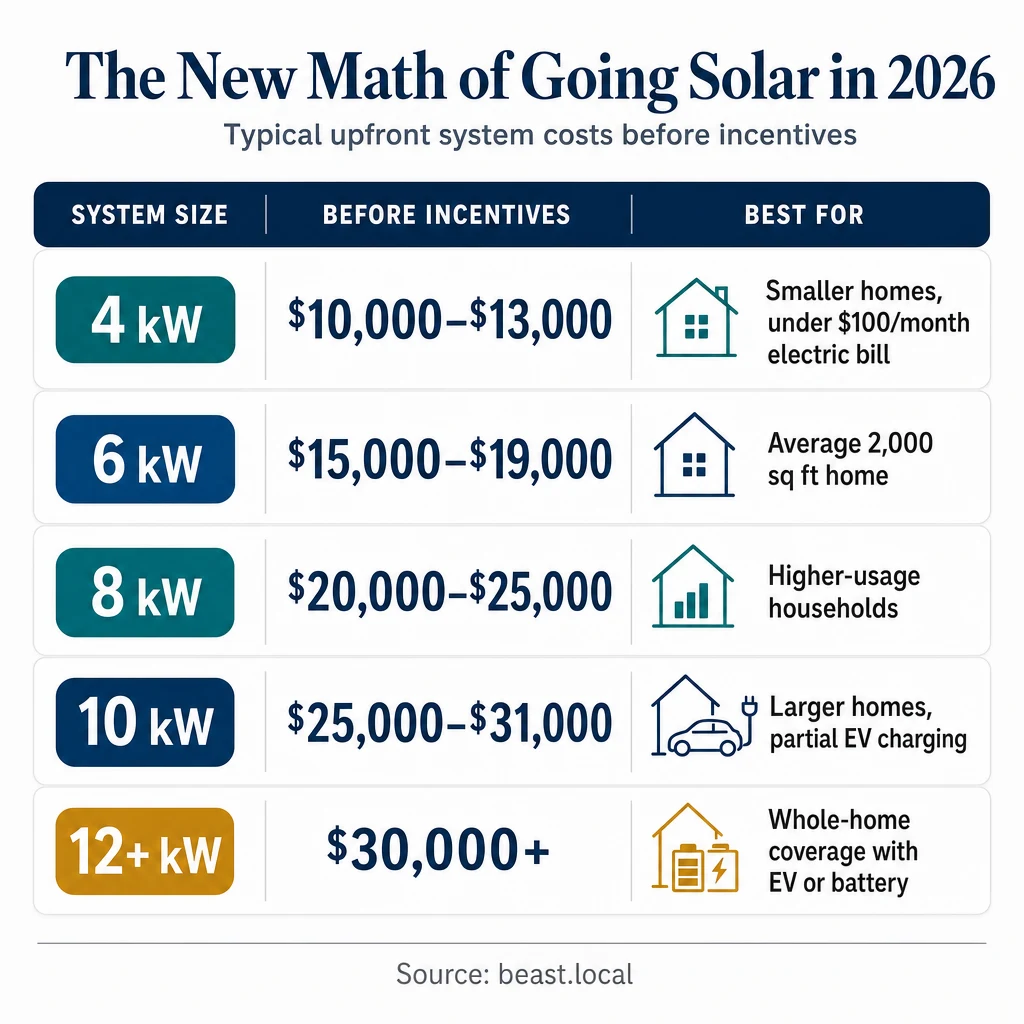
Here is how residential solar pricing breaks down for most U.S. homes, according to market data:
| System Size | Before Incentives | Best For |
|---|---|---|
| 4 kW | $10,000-$13,000 | Smaller homes, under $100/month electric bill |
| 6 kW | $15,000-$19,000 | Average 2,000 sq ft home |
| 8 kW | $20,000-$25,000 | Higher-usage households |
| 10 kW | $25,000-$31,000 | Larger homes, partial EV charging |
| 12+ kW | $30,000+ | Whole-home coverage with EV or battery |
The national average for a complete solar installation equipment, labor, permitting falls around $19,000-$25,000 for a typical 6-8 kW home system. Larger homes or more complex installations push that number higher. A few factors determine where any given project lands in those ranges: system size relative to electricity usage, roof design and shading, whether the electrical panel needs upgrading, local permitting and utility interconnection requirements, and installer pricing in the region.
Where the Money Actually Goes
A common frustration for homeowners is seeing how cheap solar panels have become and still receiving a five-figure installation quote. The disconnect is real, and it comes down to what the industry calls soft costs.
Of the $2.50-$3.50 per watt paid for an installed residential solar system, only $0.30-$0.70 is the panel itself. The rest goes to the inverter ($0.25-$0.45), racking and balance of system ($0.20-$0.35), installation labor ($0.50-$1.00), permits and design ($0.10-$0.20), and sales, overhead, and margin ($0.40-$0.80). Labor and soft costs together make up more than half the total.
Here is the cost breakdown for a typical 8 kW system:
| Component | Cost per Watt | % of Total | What It Covers |
|---|---|---|---|
| Solar Panels | $0.30-$0.70 | 10-20% | The modules themselves (LONGi, REC, Trina, Jinko, etc.) |
| Inverter | $0.25-$0.45 | 8-13% | String inverter or microinverters (Enphase, SolarEdge) |
| Racking + BOS | $0.20-$0.35 | 6-10% | Rails, clamps, wiring, conduit, combiner, disconnect |
| Installation Labor | $0.50-$1.00 | 16-29% | 2-3 person crew, 1-2 days, electrical connections |
| Permits + Design | $0.10-$0.20 | 3-6% | Building permit, electrical permit, interconnection application, engineering stamp |
| Sales + Overhead + Margin | $0.40-$0.80 | 13-23% | Customer acquisition, company overhead, warranty reserves, profit |
| Total Installed | $1.75-$3.50 | 100% | Everything from contract to commission |
Equipment accounts for roughly 55-60% of total installed cost, with solar panels representing only a fraction of that. This is why hardware price declines in recent years have not translated into proportional drops in what homeowners pay at the point of installation.
The Federal Tax Credit: What Changed and What Remains
One of the most significant changes homeowners encounter in 2026 is the elimination of the federal residential solar tax credit. The 25D Residential Clean Energy Credit which previously allowed homeowners to deduct 30% of a solar installation's cost from their federal taxes expired on December 31, 2025, as part of the One Big Beautiful Bill.
What this means practically: cash and loan purchases no longer receive a federal tax offset. The credit was a dollar-for-dollar reduction on your tax bill, not a deduction on a $24,000 system, it was previously worth $7,200 back on your taxes. It applied to everything: panels, labor, permits, even battery storage. Unused credit rolled forward to future tax years. None of that applies to 2026 purchases.
There is one nuance worth noting: leases and Power Purchase Agreements (PPAs) may still reflect incentive value. The company that owns the system typically a large installer or a financing partner can capture available commercial credits and pass savings through to the homeowner via lower monthly payments. For homeowners who prefer low upfront costs, leases and PPAs are a more prominent option in 2026 than they were in prior years.
State and utility incentives remain in place in many markets and have become the primary financial levers for homeowners who buy their systems outright. Depending on the state, these can add up to $0-$8,000 or more in direct savings, though availability and structure vary widely.
Regional Variation: Why Your Zip Code Matters
Solar costs in 2026 have been shaped by two converging forces: hardware prices that have never been lower, and the end of the federal residential tax credit that many homeowners counted on for years. But there is a third force that often gets lost in national averages: geography.
Your location matters a lot. A 6 kW system in Arizona might cost $15,000, but the same system in New York could run $19,000 due to labor rates and permitting complexity. Prices vary 20-30% between companies for the same system in the same region, and regional differences can be even wider.
Roof type plays a significant role. Standard asphalt shingles allow for straightforward installation. Clay tile, flat roof, or complex rooflines require specialized mounting and can add $1,000-$3,000 to a project. Panel choice also affects the quote: economy 400W panels run approximately $0.80/watt, while premium 545W panels cost $1.20-$1.50/watt but require fewer panels and less roof space.
Electrical panel upgrades, multiple roof planes, long cable runs, and utility interconnection requirements all add cost. The only way to get an accurate number for a specific home is a site-specific assessment national averages are a starting point, not a quote.
Are Solar Panels Still Worth It in 2026?
This is the question every homeowner ultimately lands on, and the honest answer is: it depends on your specific situation, but the fundamentals still hold for many households.
Solar costs have fallen more than 60% since 2014, per NREL benchmarking data, but the decline has leveled off in recent years. Supply chain stabilization and a maturing installer market mean prices are relatively flat right now. Hardware is genuinely cheap by historical standards.
The variables that determine whether solar makes financial sense for you include your current electricity rates (the higher your monthly bill, the faster the payback), roof orientation and shading (south-facing, unshaded roofs perform best), local utility net metering rules (how much credit you get for excess power sent to the grid), your financing method, and how long you plan to stay in the home.
For homeowners with high electricity bills, good roof conditions, and plans to stay in place for five to seven years or more, solar often still pencils out. State incentives in some markets can replicate much of what the federal credit used to provide. And electricity rates continue to climb the fuel that solar displaces is getting more expensive every year.
For renters, homeowners with poor roof conditions, or those planning to move within a few years, the calculus is less clear. Battery storage adds $9,000-$20,000 to a project and extends the payback period, though it provides value in areas with frequent outages or unfavorable net metering policies.
What This Means for Solar Panel Costs in 2026 Readers
If you are researching solar panel costs in 2026, the most important shift to understand is not that solar became expensive it is that the financial structure around it changed. The federal tax credit that anchored many years of planning and marketing is gone. What remains is a market where hardware is cheap, installation costs are sticky, state incentives vary widely, and regional installer competition can mean thousands of dollars of difference between quotes.
The practical implication: the decision to go solar in 2026 requires more careful site-specific analysis than it did when a 30% federal credit was available to offset upfront uncertainty. That is not a reason to avoid it it is a reason to approach it more deliberately, with real numbers for your specific home more than national averages.
Get multiple quotes. Understand your state's incentive landscape. Factor in your electricity rate trajectory and how long you plan to stay. The fundamentals of solar economics free fuel, rising utility rates, increased home value still apply. The wrapper around them just changed.
Will Solar Prices Go Down Further?
Residential solar prices face a mixture of economic headwinds and tailwinds in 2026. While a dramatic drop in pricing is not expected, there are structural reasons to believe installation costs will continue to moderate over time.
Soft costs labor, permitting, customer acquisition represent the largest share of what homeowners pay. These are harder to compress than hardware, but they are not immune to efficiency improvements. Streamlined permitting processes, better installer workflows, and increased market competition all exert downward pressure over time.
Panel efficiency continues to improve, meaning more wattage per square foot of roof. This does not directly lower the per-watt price, but it reduces the number of panels needed for a given energy target, which can lower total system cost in practice.
The honest answer is that prices are unlikely to drop dramatically in the near term. Waiting for a significant price decline is not a reliable strategy. The better approach is to evaluate solar on its current merits, understand the actual cost breakdown, and make a decision based on your specific home and financial situation.
Where to Read Further
For homeowners ready to explore what solar would cost for their specific home, the most useful next step is a site-specific assessment using a solar calculator that accounts for local utility rates, roof conditions, and current installer pricing in their area. The Solar Energy Industries Association publishes quarterly market data that tracks national pricing trends, and state energy offices maintain lists of available local incentives.
Those researching the current state of solar pricing, regional cost variation, and incentive availability can find detailed breakdowns at Solar.com's 2026 solar pricing overview, which tracks how policy changes have reshaped the residential market. TheGreenWatt's cost guide provides per-watt pricing, component-level cost breakdowns, and system-size estimates that help translate national averages into practical figures. Green Energy Calculators' complete US price guide offers state-by-state context and financing options for homeowners building a real budget.
For readers in states with active incentive programs, checking the specific offerings from state energy offices and local utilities remains the most reliable way to understand what financial support is currently available and how it compares to the federal credit that is no longer in place.