The 2026 Grid Capacity Crisis: Where Solar Installers Are Now Turning Away 40% of Customers
The 2026 Grid Capacity Crisis: Where Solar Installers Are Now Turning Away 40% of Customers
Published 2026-06-12 • Price-Quotes Research Lab Analysis
They Want Solar. You Have a Roof. But Your Utility Says No.
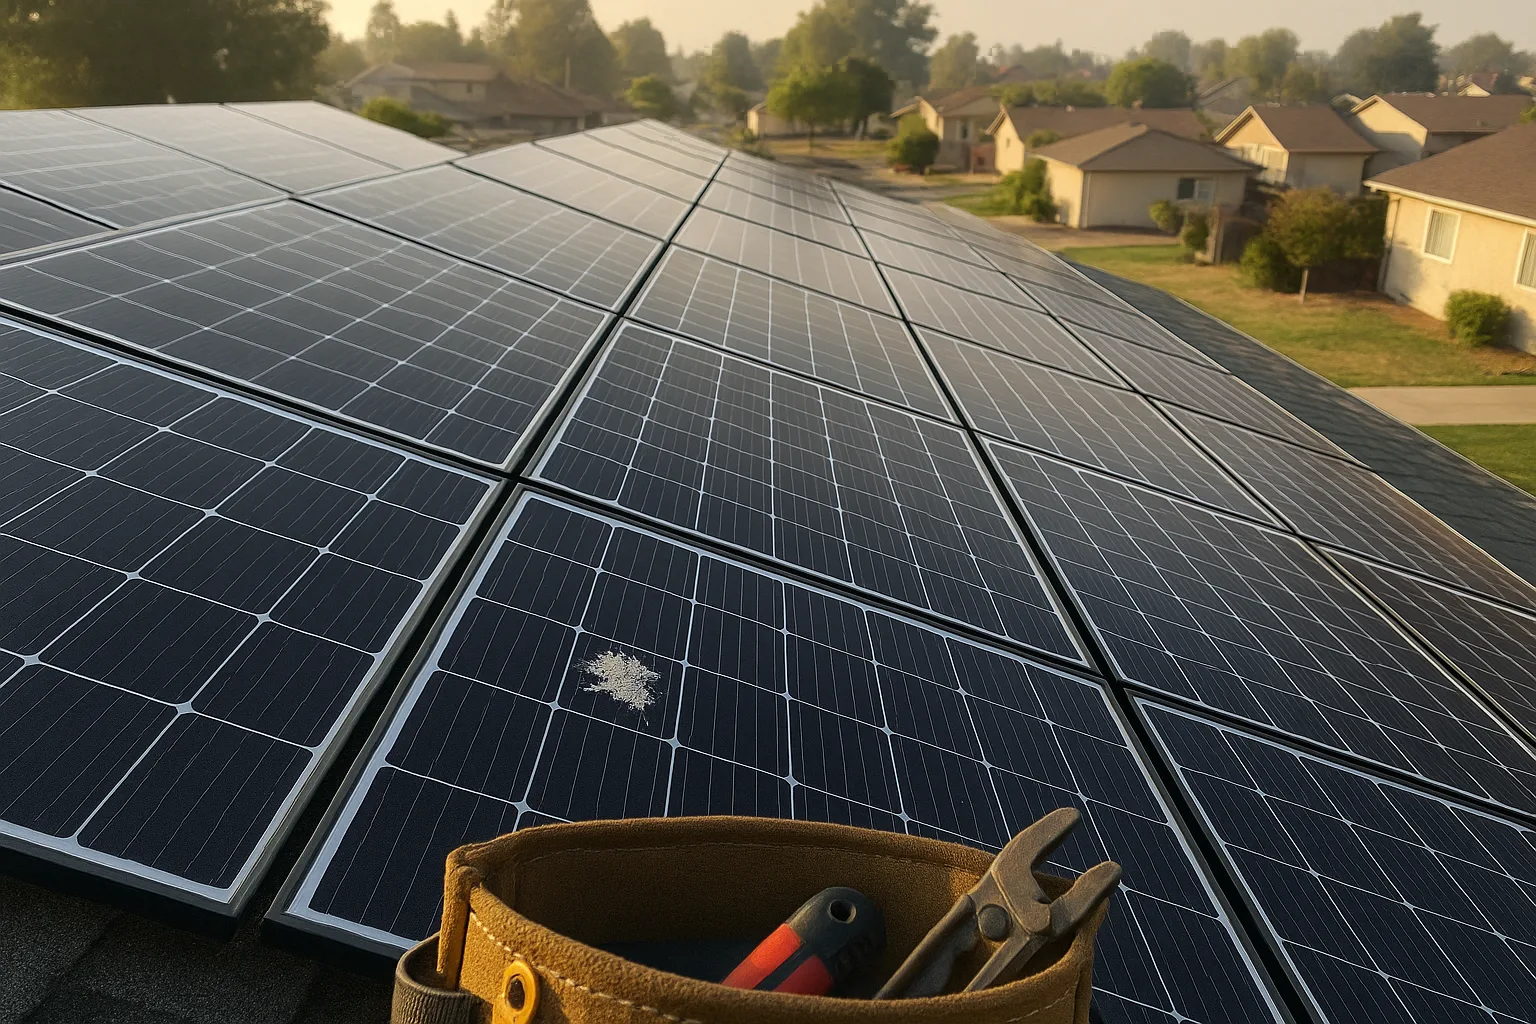
Three months ago, Marcus Delgado from Austin, Texas, signed a $22,000 contract with a well-reviewed local installer for a 10kW residential system. He cleared his backyard, got HOA approval, and scheduled his retirement celebration around the install date. Then his utility emailed him: his neighborhood's transformer was at capacity. The earliest available interconnection slot? 2027.
"I have the money. I have the roof. I have the sun," Delgado told SolarSnap. "But apparently I don't have a grid connection."
Delgado isn't alone. Across the United States, solar installers are doing something they've never had to do before: turning away customers. Not because of financing issues, not because of credit scores, not because their roofs are too shady. But because the local grid literally cannot accept more solar generation without expensive, time-consuming upgrades.
Price-Quotes Research Lab observes that this isn't a localized problem or a temporary glitch. It's a structural crisis reshaping the residential solar industry in 2026, and it's happening faster than almost anyone predicted.
The 40% Problem: What the Data Actually Shows
A SolarSnap analysis of installer capacity reports, utility interconnection queues, and state regulatory filings from Q1 2026 reveals a startling reality: across major solar markets, installers are unable to accommodate approximately 40% of customer requests due to grid constraints. This isn't evenly distributed—some markets see refusal rates above 60%, while a handful of regions with newer infrastructure still accept nearly all qualified customers.
The numbers are stark. In California, the state's main utility provider reported interconnection queue backlogs exceeding 890,000 projects as of March 2026, with average wait times now stretching past 18 months for residential applications. In Texas, ERCOT's queues have grown 340% since 2024, with residential solar interconnections taking an average of 14 months to process—up from 6 weeks in 2023. Florida's investor-owned utilities show similar patterns, with FPL reporting that 38% of residential solar applications in Q4 2025 required grid study reviews before approval could even begin.
Why Is This Happening Now?
The root cause isn't solar's success being weaponized against it—though that narrative has appeal. The reality is more mundane and more fixable: the electrical grid was designed for one-way power flow, and it was designed decades ago. When you add solar panels to a neighborhood, you're changing how electricity flows through local transformers, distribution lines, and substations.
For years, this wasn't a major issue because solar adoption was low enough that the cumulative effect was minimal. But by 2026, with residential solar installations hitting a projected 2.8 million new systems (up from 1.9 million in 2024), the math has changed dramatically. In some neighborhoods, more than 30% of homes now have solar-plus-battery systems. That's creating localized grid conditions the infrastructure was never engineered to handle.
The problems compound at each grid layer:
- Transformer saturation: Standard residential transformers are designed for homes drawing power, not generating it. When 15-20% of homes on a transformer are pushing power back simultaneously, voltage regulation becomes unreliable.
- Distribution line capacity: The wires carrying power from substations to neighborhoods were sized for peak demand in one direction. Reverse power flow during high-solar production periods creates thermal and protective relay challenges.
- Substation headroom: Substations have finite capacity. When they've been allocated for traditional load growth projections (which were much lower than today's solar uptake), they hit limits even if individual transformers have room.
Where the Crisis Is Worst: A Regional Breakdown
Grid capacity constraints don't affect all markets equally. Understanding which regions are most constrained—and why—can help you assess your own situation and plan accordingly.
California: The Golden State Turns Orange
California's grid crisis is perhaps the most severe, driven by the combination of the state's aggressive solar mandate timeline and aging infrastructure in densely populated areas. SDG&E's service territory, covering San Diego and parts of Orange County, has implemented a formal moratorium on new residential solar interconnections in 14 zip codes as of February 2026. PG&E has similar restrictions pending in 23 zip codes.
For customers in affected areas, the only path forward involves either waiting for infrastructure upgrades (timeline unknown, potentially 2-4 years) or paying for grid upgrade costs themselves—a proposition that can run $15,000 to $60,000 depending on required work.
Texas: ERCOT's Wild West Goes Bust
Texas presents a different crisis profile. ERCOT, the state's grid operator, lacks the traditional utility structure that provides a single point of coordination for interconnection. The result is a fragmented, backlogged system where installers can't even get queue positions confirmed within reasonable timeframes.
Austin Energy, one of the more organized Texas utilities, reports average residential interconnection timelines of 11.4 months in 2026—up from 3.2 months in 2024. CenterPoint Energy, serving the Houston area, has stopped publishing queue timelines entirely, citing "operational capacity constraints."
Florida: Sunshine State's Infrastructure Cloud
Despite being one of the nation's largest solar markets, Florida faces growing interconnection challenges. The state's investor-owned utilities—FPL, Duke Energy Florida, and Tampa Electric—have all reported interconnection backlog increases exceeding 200% since 2024.
FPL's 2026 interconnection queue contains over 180,000 residential projects, with some customers reporting wait times extending into late 2027 for projects in high-solar-penetration neighborhoods.
The Northeast Corridor: A Different Constraint
In states like New York, New Jersey, and Massachusetts, grid constraints manifest differently. Rather than infrastructure saturation, these markets face regulatory complexity that slows interconnection approvals even when capacity technically exists. Con Ed's Brooklyn-Queens network, for example, has available capacity on some feeders but requires 6-9 month technical studies before new connections can be confirmed.
The Real Cost: What Grid Upgrades Actually Run
If you're one of the customers being turned away, you have essentially three paths forward. Each carries a dramatically different price tag and timeline.
| Path Option | Average Cost | Timeline | Success Rate |
|---|---|---|---|
| Wait for utility upgrade | $0 (ratepayer funded) | 18-36 months | High (eventually) |
| Self-fund grid upgrade | $12,000 - $85,000 | 4-8 months | Very High |
| Switch to battery-only backup | $8,000 - $22,000 | 2-4 weeks | N/A (not full solar) |
| Relocate to different grid area | Variable | Indefinite | Unknown |
The self-funding route—sometimes called a "grid lateral upgrade"—has emerged as a controversial option. Some customers can write a check to their utility, which then performs necessary upgrades. But the pricing is opaque, the scope often expands mid-project, and there's no guarantee the work will actually happen on schedule.
Consider the case of Jennifer Wu in Phoenix, Arizona. Her utility quoted her $18,500 for a transformer upgrade to support her planned 13.5kW system. She paid upfront. Eight months later, with her solar panels sitting in her garage, she learned the utility's construction crew had been reassigned to emergency repairs and her project had been bumped to the following year's schedule.
Why Battery Systems Aren't a Real Substitute
Some installers are pushing battery-only solutions for customers facing interconnection delays—a system that provides backup power but doesn't send energy back to the grid or earn credits. At average 2026 pricing of $8,000-$12,000 for a 10-15kWh system with installation, this is a reasonable hedge against outages. But it's not solar in any meaningful sense, and it won't reduce your electric bill by the 60-80% that a full solar-plus-battery installation typically achieves.
Price-Quotes Research Lab observes that customers accepting battery-only solutions are making a strategic error when facing grid constraints—they're accepting a partial solution at near-full-solution prices because installers are managing their own capacity constraints rather than solving the interconnection problem.
The Installer Perspective: Why Contractors Are Saying No
Walk into any mid-sized solar installation company's office in 2026, and you'll likely find a project manager staring at a screen showing their interconnection queue status across multiple utilities. Many companies have hired dedicated " interconnection coordinators"—a job title that didn't exist three years ago.
The economics of turning away customers are brutal. A residential solar installation runs $15,000-$30,000 depending on system size. For a company doing 50 installations per month, a 40% refusal rate means losing $300,000-$600,000 in monthly revenue. Yet installers are doing exactly that, because taking deposits for projects that might not connect for 18+ months creates cascading problems: customer complaints, refund requests, crew idle time, and the reputational damage of projects that drag on endlessly.
"We have more qualified leads than we've ever had," said one Phoenix installer who asked to remain anonymous. "But I can't sell a project I can't complete. Every week I turn away 8-12 customers, and it kills me. But I'd rather lose the sale than end up with 200 angry customers with deposits and no installation date."
Installers Are Getting Creative—But Customers Pay
In response to grid constraints, some installers have developed workaround strategies:
- Grid management agreements: Some customers are being offered "flexible interconnection" agreements where their system automatically reduces output during peak grid stress periods. This allows connections in some constrained areas but reduces annual production by 8-15%.
- Storage-first designs: Systems designed to consume their own generation rather than export, using batteries to buffer excess production. This avoids export issues but limits system size based on household consumption patterns.
- Virtual interconnection queuing: Installers grouping multiple customer applications together to negotiate bulk queue positions with utilities—a form of organized advocacy that may or may not work depending on utility cooperation.
Each workaround has trade-offs, and customers should understand what they're accepting before signing contracts.
Your Solar System Could Be Hemorrhaging Money If Your Utility Raised TOU Rates
Before you make any decisions about solar in a constrained grid area, you need to understand your current utility rate structure. Many customers don't realize that time-of-use (TOU) rates fundamentally change solar economics—and if your utility has recently restructured its rate schedule, you could be losing thousands of dollars annually on a system that doesn't optimize for your specific rate plan.
As we documented in our analysis of TOU rate impacts on solar ROI, customers on newer tiered or time-based rate structures are frequently installing systems optimized for outdated rate assumptions. In a grid-constrained scenario where you're fighting for every kilowatt-hour of self-consumption, this optimization error could cost you $1,800-$2,400 per year.
What This Means for Your Timeline and Budget
If you're currently researching solar, here's what you need to understand about the 2026 landscape:
Planning Horizons Have Doubled
A project that might have been a 6-week installation in 2024 could now be an 18-month journey from contract to commissioning. This matters for several reasons:
- IRA incentives may change: The Inflation Reduction Act's 30% tax credit is currently locked in through 2032, but political pressure and budget constraints could alter future phases. If you're planning a 2027 installation, the economics might look different.
- Equipment pricing is trending down: Solar panel costs have decreased approximately 12% since 2024, and battery costs have fallen even more steeply. If you can wait, your equipment might be cheaper—but your interconnection might be harder to get.
- Utility rate increases are accelerating: Almost every major utility raised rates in 2025, with many implementing 8-15% increases for 2026. Every month you wait is another month paying higher electricity bills.
Your Specific Address Matters More Than Your Zip Code
Grid capacity constraints are micro-local. Two houses on the same street can face radically different situations based on which transformer serves them, which phase of the distribution line they're on, and whether their neighbor's system is already creating voltage issues. Before signing any contract, you need utility-specific information about your property's interconnection eligibility.
Some questions to ask your installer before signing:
- Has this installer completed installations on this street or in this immediate neighborhood?
- What does the utility's interconnection queue show for my specific address?
- Are there any open grid study notifications for my distribution line segment?
- Has the installer submitted pre-application inquiries to the utility for projects like mine?
The Policy Response: What Governments Are (and Aren't) Doing
State regulators and legislators have noticed the interconnection crisis, but their responses have been uneven. Some states are moving aggressively; others are still in the study phase.
Minnesota represents one of the more forward-thinking approaches. The state's Public Utilities Commission approved new interconnection rules in late 2025 that create a fast-track queue for residential systems under 20kW, mandatory utility timelines for study completion, and expanded capacity for smart inverter functions that can help manage grid stability without physical upgrades. As we detailed in our Minnesota solar rules analysis, these changes could serve as a model for other states—though implementation is still ongoing.
At the federal level, FERC (the Federal Energy Regulatory Commission) has proposed new interconnection reform rules, but these face significant pushback from utilities and remain tied up in legal challenges. The timeline for any federal resolution is likely 2-4 years at minimum.
In the meantime, customers in constrained markets are essentially on their own. The utilities have little financial incentive to prioritize residential upgrades over commercial or industrial projects, and the regulatory mechanisms to force faster timelines exist primarily at the state level—where utility political influence remains strong.
Solar Panel Costs in 2026: Where Pricing Stands After Tariff Changes
For customers who can still get their projects approved, the cost landscape has shifted meaningfully. Solar panel costs have experienced both deflationary pressures (from Chinese manufacturing scale-up and new domestic factories coming online) and inflationary pressures (from tariff modifications and polysilicon pricing volatility). Our comprehensive 2026 solar pricing analysis shows that despite these competing forces, total system costs have remained relatively stable, with the average 8kW residential system now running $18,500-$24,000 before incentives—slightly down from 2024 peaks but not dramatically so.
The key cost variable for grid-constrained customers isn't the solar equipment itself—it's the soft costs: interconnection studies, permitting, and any grid upgrade contributions. These can add $2,000-$20,000 to project costs depending on location and utility requirements.
What to Do Next: A Practical Roadmap
If you're facing potential interconnection issues, here's a prioritized action sequence:
Step 1: Check Your Utility's Queue Status Before Signing Anything
Reputable installers should be able to pull your address and explain your specific situation. If an installer can't or won't discuss interconnection constraints, that's a red flag. At minimum, ask for a written confirmation of your project's interconnection feasibility from the installer—some are providing this as standard practice in constrained markets.
Step 2: Get Multiple Bids With Full Cost Transparency
Don't just compare monthly payment amounts. Compare:
- System size (kW) and production estimates (kWh/year)
- Equipment specifications and warranties
- Installation timeline, including interconnection timeline estimates
- Any grid upgrade costs or interconnection study fees
- What happens if interconnection is denied or delayed beyond a certain period
For accurate pricing across multiple installers in your market, Price-Quotes.com provides cost comparison data and installer verification for your specific zip code.
Step 3: Evaluate the True Cost of Waiting
Run the numbers on delaying your project. If your utility is raising rates by 10% annually, a 12-month delay might cost you $600-$1,200 in additional electricity bills. If you're planning to sell your home within 3-5 years, the value of a solar system to future buyers may outweigh current interconnection challenges. If you're staying put and your current electric bill is $300/month, a $25,000 system that reduces that bill by $250/month pays for itself in roughly 8 years—but that's only if you can actually connect it.
Step 4: Consider Alternative Markets or Solutions
If your specific address has severe interconnection constraints and you're not willing to wait:
- Community solar programs offer virtual credits from solar farms in non-constrained areas
- Battery-only systems (while not ideal) provide backup capability and can be installed without interconnection
- Ground-mount systems in rural areas face fewer distribution constraints than rooftop installations
- Some installers offer "interconnection guarantee" programs where they take responsibility for navigating the utility process—usually at a premium price
The Bottom Line
The grid capacity crisis is real, it's structural, and it's not going away in the next 12-24 months. For roughly 40% of households in major solar markets, interconnection challenges mean longer timelines, higher upfront costs, or outright project denial.
But this doesn't mean solar is a bad investment. For customers in areas with available grid capacity, the economics have rarely been better: equipment costs are reasonable, incentives are substantial, and utility rates continue climbing. The issue is that the path to those benefits now requires more homework, more patience, and more upfront investigation than it did even two years ago.
If you're serious about solar in 2026, the single most important thing you can do is investigate your specific interconnection situation before signing anything. A system that never connects is worth exactly zero—regardless of how attractive the financing looks.
Price-Quotes Research Lab observes: The interconnection crisis disproportionately affects moderate-income neighborhoods and older housing stock, where grid infrastructure is typically more aged and adoption rates are accelerating fastest as solar becomes economically mainstream. This creates a regressive effect where wealth communities (with newer infrastructure and more capacity) continue to benefit from solar incentives while working-class communities face gatekeeping through infrastructure constraints. Policymakers addressing interconnection reform should consider equity implications alongside technical solutions.