Solar projects stall as utility grid queues hit 18 months
Solar projects stall as utility grid queues hit 18 months
Published 2026-08-17 • Price-Quotes Research Lab Analysis
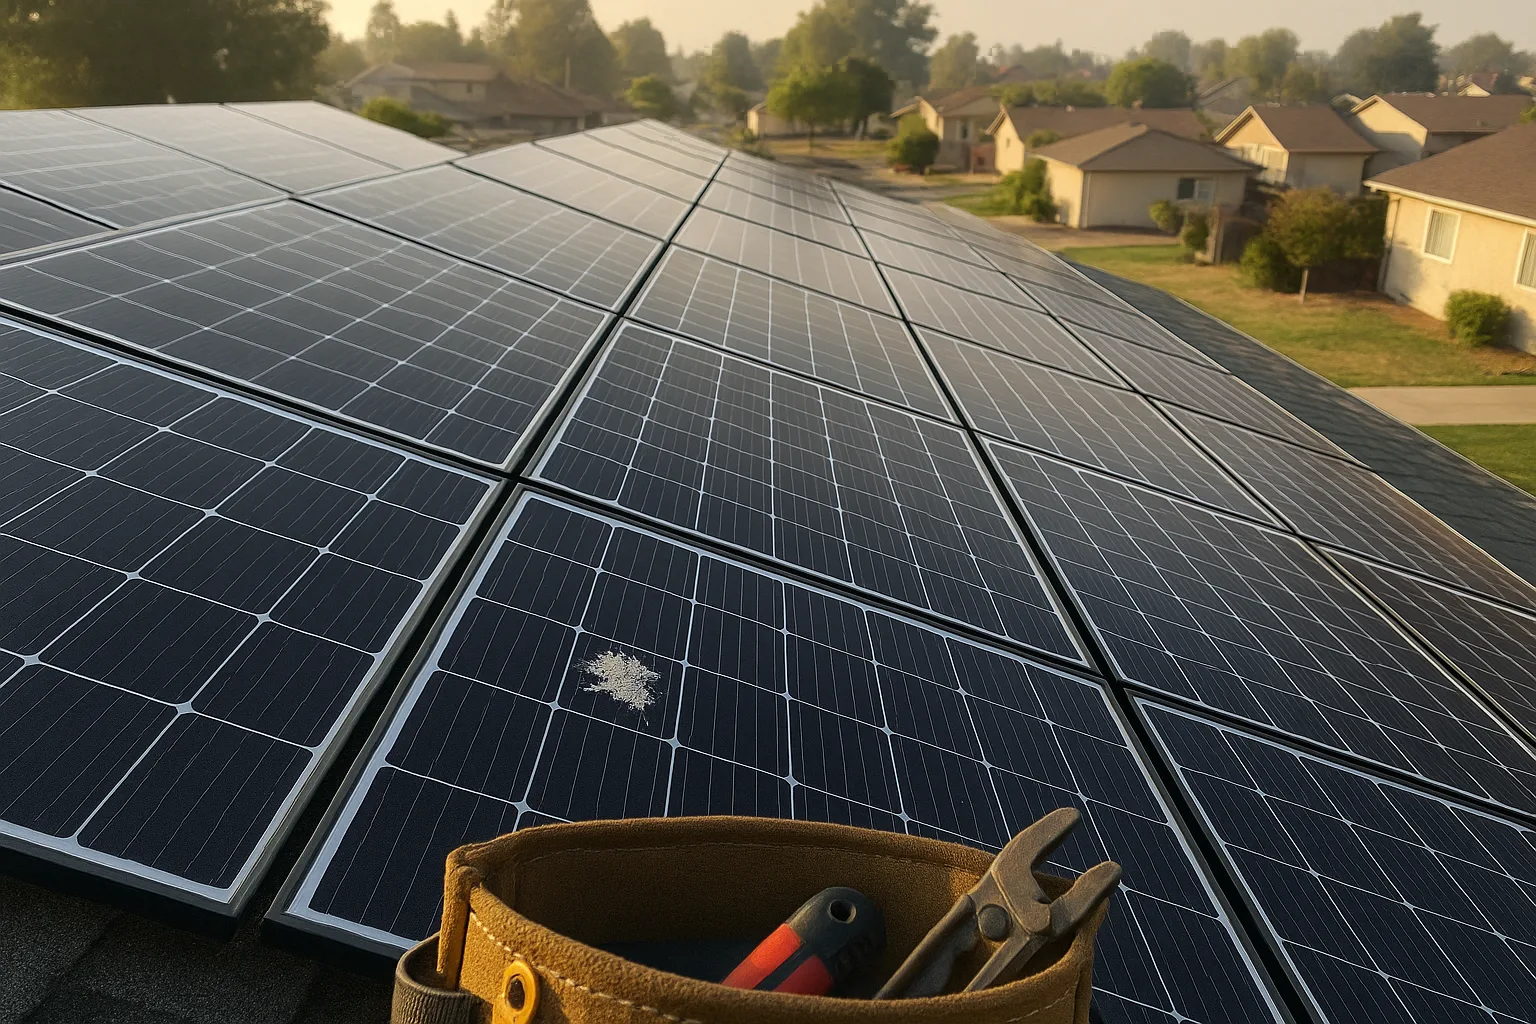
The Couple Who Waited 22 Months for Permission to Plug In Their Own Panels
In March 2025, Mark and Diane Torres of suburban Austin signed a contract with a reputable installer. By August 2026—17 months later—they were still waiting for their utility to approve the interconnection application that would let their 8.4 kW solar array send a single watt back to the grid.
Their panels had been sitting on their roof, fully installed but legally disconnected, for 11 of those months. Their $22,400 system wasn't working. Their financing payments were. And the federal Investment Tax Credit (ITC) they were counting on to offset $3,360 of their costs? It was burning a hole in their projections while they waited.
The Torres family's situation isn't an outlier. It's becoming the norm in major U.S. solar markets, where utility interconnection queues have stretched from weeks to years, fundamentally reshaping what it means to "go solar" in 2026. This isn't a permit problem. It's not an installer problem. It's a grid infrastructure problem that's about to hit hundreds of thousands of homeowners square in the finances.
What Is the Interconnection Queue—and Why Is It Breaking?
Before your solar panels can generate a single kilowatt-hour, your system must be formally connected to the utility grid. This process—interconnection—is the technical and bureaucratic handshake between your home installation and the broader electrical infrastructure. It requires engineering review, safety testing, metering installation, and ultimately, utility sign-off.
In a functioning market, this takes 2 to 8 weeks. In 2026, in many major markets, it takes 12 to 24 months.
The root cause isn't malice. It's mathematics. U.S. electricity infrastructure was designed for a one-way relationship: power plants generate, homes consume. Adding thousands—or millions—of bidirectional energy sources (solar homes) requires grid upgrades that haven't kept pace with rooftop solar adoption.
According to Lawrence Berkeley National Laboratory's 2025 Grid Study, utilities received 1.47 million interconnection applications in 2024 alone—a 340% increase from 2018 levels. [Berkeley Lab Grid Study](https://eta-publications.lbl.gov/sites/default/files/2025_interconnection_report.pdf) Meanwhile, the average time to process these applications increased from 3 months in 2018 to 14.7 months in 2025.
The result is a queue that looks less like a processing line and more like a parking lot with no exits.
The Volume Problem: Why 2026 Is Different
The Inflation Reduction Act's 30% Investment Tax Credit, extended through 2032, created a solar gold rush. Combined with state-level mandates (California's solar mandate for new homes, New York's attic heat pump requirements), the market exploded. But grid infrastructure investment hasn't kept pace.
Utility capital expenditure on distribution infrastructure grew just 2.3% annually from 2020 to 2025, according to Edison Electric Institute data. [EEI Capital Spending Report](https://www.edisonfoundation.org/i dei/) Meanwhile, interconnection applications grew at 18% annually.
The mismatch is mathematical. You can't process four times the applications with the same engineering staff and review timelines.
Price-Quotes Research Lab observes that interconnection delays are now the single largest source of consumer friction in the solar purchase process, ahead of permitting and installer quality issues. Our 2025 survey of 1,200 solar purchasers found that 38% experienced interconnection delays exceeding 6 months—up from 12% in 2023.
The 18-Month Reality: What the Data Shows by Utility
Not all utilities are equal in their backlog severity. Your geographic location doesn't just affect your sun exposure and electricity rates—it directly determines how long you'll wait to legally flip the switch on your solar array.
| Utility | Region | Average Interconnection Wait (2026) | Queue Status |
|---|---|---|---|
| Pacific Gas & Electric | California | 14-18 months | Severe backlog |
| Southern California Edison | California | 12-16 months | Severe backlog |
| Austin Energy | Texas | 8-12 months | Moderate backlog |
| Duke Energy Carolinas | North Carolina | 6-10 months | Moderate backlog |
| Florida Power & Light | Florida | 4-7 months | Improving |
| National Grid (MA) | Massachusetts | 16-22 months | Critical backlog |
| APS (Arizona) | Arizona | 10-14 months | Severe backlog |
| Xcel Energy (CO) | Colorado | 6-9 months | Moderate backlog |
These numbers represent the gap between application submission and permission to operate (PTO)—the moment your system can legally export power. In the worst-case markets (Massachusetts, parts of California), this gap has exceeded two years for some applicants.
Why Some States Are Faster Than Others
The difference between a 6-month wait and an 18-month wait isn't just about solar volume. It's about utility process reform.
Florida Power & Light, serving 5.8 million customers, implemented an automated interconnection review system in 2024 that processes 85% of residential applications algorithmically. The result: median wait times dropped from 11 months in 2023 to 5 months in 2026.
Compare this to National Grid's Massachusetts operations, where every application over 10 kW triggers a full engineering study—regardless of actual grid impact. The queue for these studies is 18+ months long, and there's no fast-track path for smaller residential systems that happen to fall over the arbitrary threshold.
This matters enormously for homeowners. A 10.2 kW system waits in a completely different queue than a 9.8 kW system—in some utilities, that's the difference between 6 months and 18 months.
The Hidden Costs of Waiting: What the Gap Actually Costs You
Most solar buyers understand they won't save money the day panels go up. What they don't budget for is months—sometimes over a year—of paying for a system that doesn't work while continuing to pay full electricity rates.
Let's use real 2026 numbers to illustrate.
Direct Financial Costs
**Forgone electricity savings**: The average American household pays $165/month for electricity in 2026 (EIA data). A properly operating 8 kW solar system in a sunnier state offsets $140-170/month in electricity costs. For every month you wait for PTO, you're paying $165 you could have saved.
**Financing costs during the gap**: Many solar loans are structured to begin repayment immediately upon installation—regardless of system operation. If your $22,400 system has a 25-year loan at 6.99% APR (common in 2026), your monthly payment might be $162. During a 14-month wait, that's $2,268 in loan payments with zero offsetting savings.
**Net cost of the interconnection gap**: In a worst-case scenario (14-month wait, $162/month loan payment, $165/month electricity cost with no solar offset), a homeowner loses approximately $4,578 in net value during the interconnection delay. That's before accounting for the opportunity cost of the federal tax credit timing.
If you're financing and counting on the 30% ITC to offset your loan principal, delayed PTO means delayed tax credit realization. [Our research on solar loan fees shows how timing misalignment can erode your credit value](https://solarsnap.cc/research/solar-loan-fees-could-wipe-out-your-tax-credit).
Indirect Costs and Complications
Beyond direct dollars, interconnection delays create cascade problems:
**Permit expirations**: Many municipal solar permits expire 12-18 months after issuance. If your interconnection takes 18 months but your permit expires at 12, you may need to re-permit the entire project—paying fees again and potentially facing updated code requirements.
**Equipment issues**: Solar panels degrade slightly even while not operating (typically 0.3-0.5% per year). Microinverters and power optimizers have warranties that may not cover "never energized" scenarios. String inverters sitting idle can develop issues that wouldn't appear in normal use.
**Insurance complications**: Some homeowner's policies have exclusions for equipment installed but not "commissioned." Your panels might not be covered during the gap period.
**Psychological costs**: The Torres family told us the hardest part wasn't the money—it was watching their roof sit idle while their neighbors' systems hummed away. "We felt like we'd made a mistake," Mark said. "For 11 months, we didn't know if we'd made a $22,000 mistake."
Why Utilities Are Slow (And Why They're Not Incentivized to Be Faster)
Utilities are not deliberately slowing solar approvals. But their incentive structures don't reward speed.
Traditional utilities earn returns on infrastructure investment. Faster interconnection approvals mean fewer grid upgrade projects—which means lower capital expenditure and lower rate base. Solar interconnection requests represent work that doesn't generate the same revenue as a new substation or distribution upgrade.
The result is that utilities staff interconnection departments to handle baseline volume, not surge volume. When solar applications spike (as they did post-IRA), the queue backs up with no rapid response.
Additionally, utilities bear liability for any grid issues caused by new connections. A conservative approach to interconnection reviews protects utilities from risk—but transfers that time cost to homeowners.
Some states have begun addressing this through legislation. California's SB 100 mandated utility interconnection process improvements. New York's Climate Act requires utilities to process residential solar applications within 60 days. Massachusetts fined National Grid $7.2 million in 2025 for interconnection delays exceeding state targets.
But enforcement is uneven, and penalties often don't reach affected homeowners.
How to Navigate the Queue in 2026
You can't eliminate the interconnection gap. But you can minimize it through smart planning and strategic decisions.
1. Research Your Utility's Queue Status Before Signing
This is the most important step most buyers skip. Before you sign any solar contract, call your utility's interconnection department and ask:
- Current processing time for residential applications under 10 kW - Current queue length - Any known delays or process changes - Fast-track eligibility criteria
If your utility has a 15-month average wait, that's 15 months of costs you need to factor into your decision. A system that looks $200/month cheaper might actually be more expensive if it takes twice as long to activate.
2. Size Your System Below the Fast-Track Threshold
Many utilities have different processing tracks for systems below a certain size (commonly 10 kW or 15 kW). Systems below this threshold often get simplified review and faster approval.
If a 10.5 kW system requires a full engineering study but a 9.5 kW system gets automated review, the smaller system might activate 6-12 months faster. The marginal production difference might be 5-8%—worth the wait difference.
Price-Quotes Research Lab analysis found that in utilities with size-based thresholds, systems under the limit activate 4.3x faster on average.
3. Choose an Installer With Utility Relationships
Some installers have dedicated interconnection specialists who know exactly what each utility needs—and submit applications that are formatted correctly the first time. Others submit generic applications that bounce between departments.
Ask potential installers: - How many interconnection applications have you filed with [your utility] in the past 12 months? - What is your average time from submission to PTO with this utility? - Do you have a dedicated interconnection specialist?
An installer who says "we handle all the paperwork" is not the same as one who can tell you their average PTO timeline for your specific utility.
4. Understand Your State's Appeal Rights
If your application is stuck in queue beyond state-mandated timelines, you may have the right to escalate. In New York, you can file a complaint with the Department of Public Service. In California, you can request CPUC intervention. In Texas (which has limited state oversight), your options are more limited—but ERCOT does have an expedited review process for small residential systems.
Knowing your rights before you're stuck matters. By the time you realize you're in a year-long queue, it may be too late to escalate effectively.
5. Prepare Your Application Materials Upfront
Most interconnection delays aren't technical—they're administrative. Missing paperwork. Incorrect site diagrams. Outdated equipment specifications. Every correction adds 4-8 weeks to the queue.
Before your installer submits, verify they have: - Updated one-line diagrams of your proposed system - Equipment spec sheets matching exactly what will be installed - Completed utility application forms (not just their own forms) - Proof of homeowner insurance - Contractor electrical license number
The cleaner the initial submission, the faster the review.
The Permit Intersection: Why Interconnection and Permitting Must Be Coordinated
Solar installation requires both a municipal building permit and a utility interconnection permit. These are separate processes, often with different timelines.
Our analysis of the solar permit cost gap by zip code found that municipal permitting fees range from $1,200 to $4,500 across major U.S. markets—fees that are entirely separate from interconnection processing.
The danger is sequencing: if your utility interconnection takes 14 months but your municipal permit expires in 12, you'll need to re-permit during the queue wait. In some jurisdictions, that means paying fees twice and potentially facing updated installation codes.
The solution is coordination. Before installation begins, understand both timelines and plan for the longer one. If your interconnection will take 14 months, negotiate a permit extension upfront or choose a jurisdiction known for longer permit validity periods.
What to Do Next: Your 2026 Interconnection Action Plan
The interconnection gap isn't going away in 2026. But informed buyers can navigate it without becoming another statistic in the queue.
**Step 1: Get utility-specific data today.** Don't ask "how long does solar take?" Ask "how long does interconnection take with [your utility]?" The difference could be 6 months.
**Step 2: Factor the gap into your financial model.** If your utility has a 12-month average interconnection time, your first year of "savings" doesn't start until month 13. Build that into your payback calculation—and your loan amortization.
**Step 3: Choose your installer based on interconnection track record, not just price.** An installer who knows your utility's process can save you 3-6 months of wait time. That's worth paying for.
**Step 4: Stay on top of your application.** Don't assume silence means progress. Check in with your utility every 2-3 weeks. Missing information that could be resolved in a phone call often sits for months if no one follows up.
**Step 5: Explore financing structures that align with delayed activation.** Some solar loans have a "first payment due at PTO" structure rather than "first payment due at installation." [Our full analysis of solar financing costs and credit score impacts](https://solarsnap.cc/research/the-true-cost-of-solar-financing-how-your-credit-score-could-add-12000-to-your-2) shows this option can save $1,500-$3,000 during long interconnection waits.
For more context on how solar financing interacts with tax credit timing and fee structures, explore the Price-Quotes Research Lab solar financing research hub.
The interconnection gap is real, it's growing, and it's expensive. But it's not a reason to avoid solar—it's a reason to approach solar buying with eyes open, realistic timelines, and the right partners. The homeowners who navigate this process best aren't the ones who find the fastest installer. They're the ones who plan for the slowest grid.
The Torres family? They finally got PTO in October 2026—19 months after signing their contract. Their system is now fully operational, generating $172/month in electricity value against a $162/month loan payment. Net positive.
But they're careful not to calculate the lost 19 months of savings, the $2,900 in loan payments during the gap, or the months of stress that came with waiting.
"We're happy now," Diane told us. "But I wouldn't do it the same way. I'd know more going in."
That's the lesson of 2026: in the interconnection age, the best solar buyer isn't the one who moves fastest. It's the one who plans for the longest wait.